Here’s a Guide on When to Care

Strategies to address missing data¹
At Indeed, our mission is to help people get jobs. Searching for a job can be stressful, which is one reason why Indeed is always looking for ways to make the process easier and our products better. Surveys provide us with an ongoing measure of people’s feelings about Indeed’s products and the job search experience.
We realize that when someone is looking for a job (or has just landed one), answering a survey is the last thing they want to do. This means that a lot of the survey data that Indeed collects ends up with missing data. To properly analyze user satisfaction and similar surveys, we need to account for potential missing patterns to ensure we draw correct conclusions.
I’d like to discuss identifying and handling missing data. I’m inspired by my training in the University of Michigan’s Program in Survey Methods. I’ve also wanted to apply the theories about data sets that I learned in academia to Indeed’s terabyte-sized data.
I recently worked on a project that dealt with missing data. I learned a lot from the analysis. Walking through this process can show how Indeed collects survey data, illustrate the difference between non-response rate and non-response bias, and provide examples of why “randomness” in non-response bias is a good thing.
One quick note: While the examples in this blog post reference Indeed, all data in this blog post are entirely bogus and made up by the author (aka me).
Measuring hires at Indeed

If you have ever canceled a job alert from Indeed, you might have seen this survey:

The purpose of this survey is to determine whether a job seeker is canceling their job alert because they found a job. This information helps us improve our products and enables us to celebrate the success stories of job seekers.
One challenge with this survey is that only a subset of job seekers completes it. From a user perspective this makes sense — people who unsubscribe from an email notification probably don’t want to spend time answering a survey. This means that we end up with a substantial amount of missing data, especially regarding a key question: did they unsubscribe because they got a job?
Non-response rate vs non-response bias

When discussing missing data, people often conflate response rate with non-response bias. When this misunderstanding of response rate is further conflated with the question of data quality, people might assume that a higher response rate means higher quality survey responses. This is not necessarily the case.
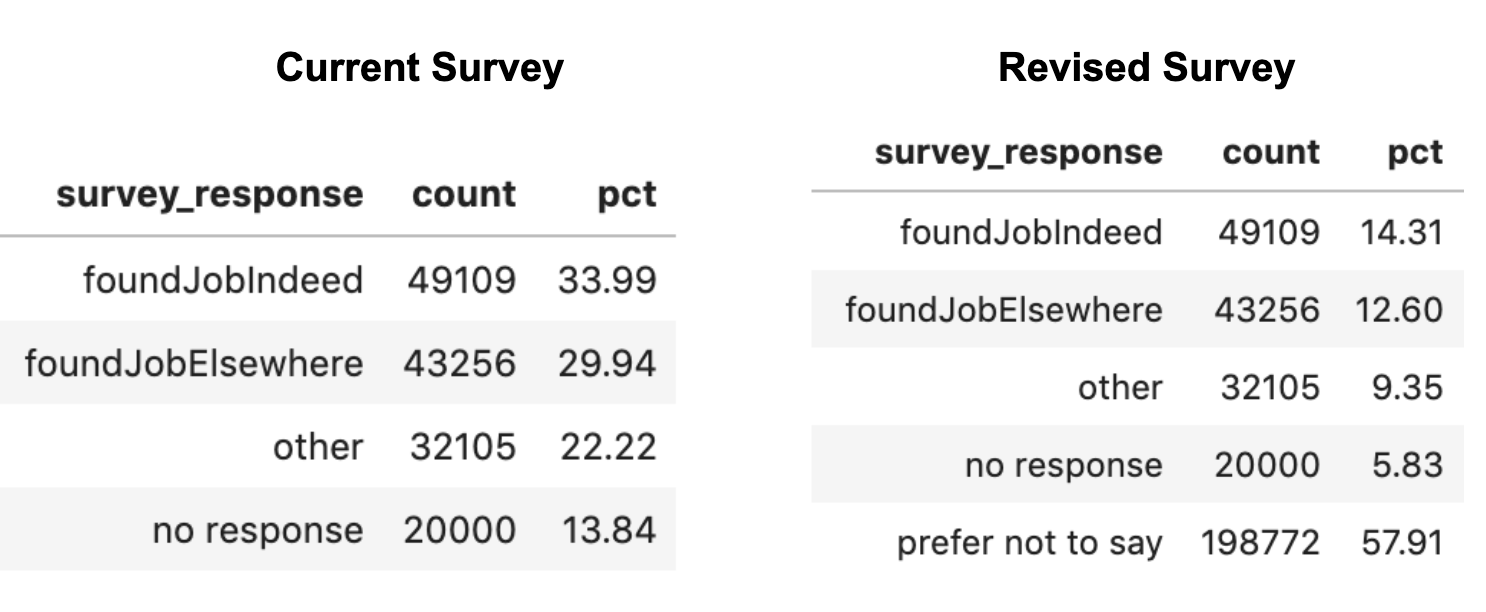
For the following job alert cancellation survey results, you’ll note that 13.8% did not respond.

Detailed description of chart.
This chart shows survey response results, including the total count of responses and percentage of whole. According to this chart:
- 49,109 survey participants (33.99%) selected “I found a job on Indeed”
- 43,256 survey participants (29.94%) selected “I found a job elsewhere.”
- 32,105 survey participants (22.22%) selected “Other.”
- 20,000 users (13.84%) did not respond to the survey
Does a non-response rate of 13.8% say something about the quality of responses in the survey?
The short answer is no. While this might initially sound counterintuitive, stay with me! Imagine that Indeed revised the job alert cancellation survey to include a “prefer not to say” option.
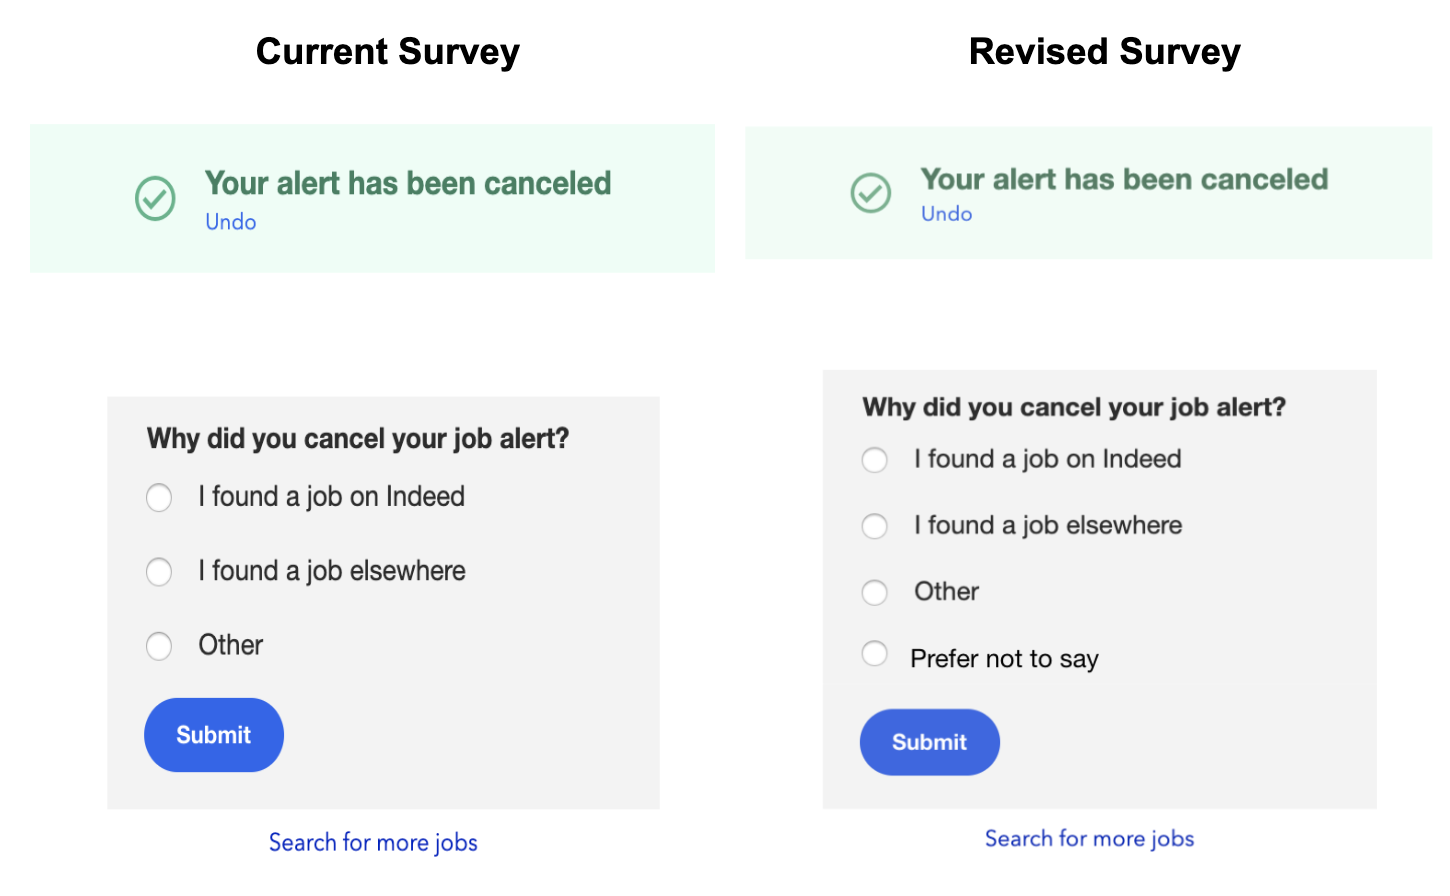
After collecting data for a few weeks, we would then see that only 5.8% of job seekers didn’t respond to the revised survey.
Detailed description of charts.
In the original survey response results:
- 49,109 survey participants (33.99%) selected “I found a job on Indeed”
- 43,256 survey participants (29.94%) selected “I found a job elsewhere”
- 32,105 survey participants (22.22%) selected “Other”
- 20,000 users (13.84%) did not respond to the survey
With the addition of the new “Prefer not to say” survey option, the results change to the following:
- 49,109 survey participants (14.31%) selected “I found a job on Indeed”
- 43,256 survey participants (12.60%) selected “I found a job elsewhere”
- 32,105 survey participants (9.35%) selected “Other”
- 20,000 users (5.83%) did not respond to the survey
- 198,772 survey participants (57.91%) selected “Prefer not to say”
Does this mean an increase in useful data? Before you start celebrating an 8% decrease in non-response, take a closer look at the response distribution. You’ll notice that a whopping 57% of job seekers selected “prefer not to say”!
Typically, we treat the response option of “prefer not to say” as missing data. We don’t know if job seekers selected “prefer not to say” because they are in the process of finalizing an offer, or for some other reason, such as concern that their current employer might find out they have a competing offer. If so, there is a potential for response bias.
Response bias refers to bias towards selecting a certain response (e.g., “prefer not to say’’) due to social desirability or another pressure. Non-response bias, also known as participation bias, refers to refusing to respond to the survey because of social desirability or another pressure.
The example above shows response bias, because respondents may have selected “prefer not to say” due to the sensitive nature of the question. If the respondents hadn’t completed the survey at all due to the nature of the survey, we would have non-response bias.
This illustrates that non-response rate alone (i.e., the percentage of people who responded to your survey) is not the sole indicator of data quality.
For example, if your most recent survey has a 61% response rate while past surveys had a response rate of 80–90%, there’s probably enough rationale to look into potential problems associated with non-response rate. However, if your recent survey has a 4% response rate and past surveys had a response rate of 3–5%, it’s unlikely that there’s a non-response issue with your specific survey. Instead, perhaps your team’s strategy in how surveys are sent (e.g., collecting survey data by landlines versus mobile phones) or how participants are identified for your study (e.g., using outdated and/or incorrect contact information) is leading to low response rates overall.
Whether you have a 3% or 61% response rate, response rate is not synonymous with low-response bias. As we saw with the revised survey, even when the response rate was high, over half of the respondents still selected “prefer not to say” — a response that isn’t usable for data analysis.
In addition to paying attention to the number of people who responded to your survey, you also need to check the distribution of the responses to each question in your survey. Simple and easy frequency statistics are a great way to notice oddities and potential biases in your data.
Missing at random vs missing not at random

Non-response bias can be summarized as whether the missing data are random or non-random. Each possibility has different implications for analysis.
Worst-case scenario: MNAR
The worst-case scenario for missing data is if it’s missing not at random (MNAR). In these cases, the missingness can be correlated with at least one variable and the missingness is likely due to the survey question being sensitive. This indicates potential problems with the survey design.
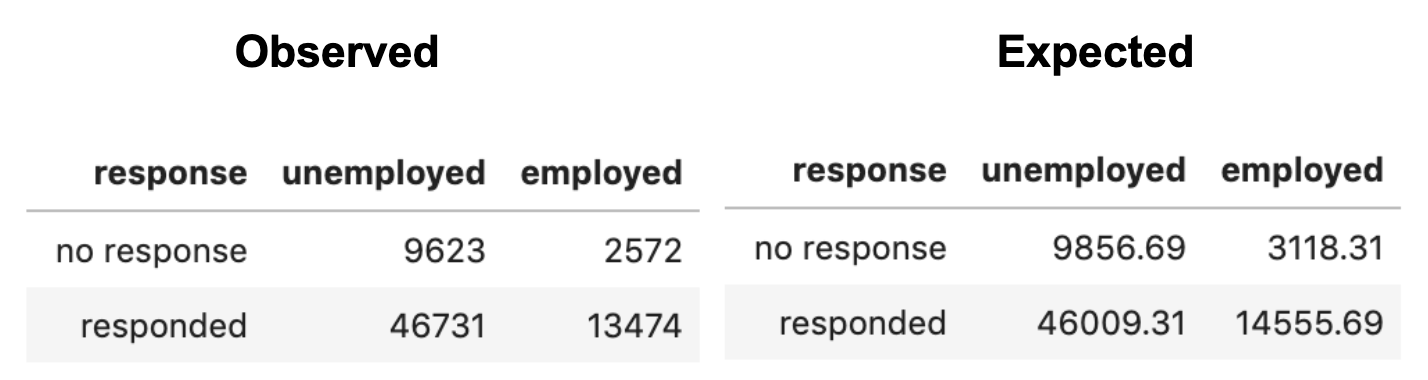
For example, let’s say we ran a chi-square test on the job alert cancellation survey to examine the relationship between survey response (no response vs. responded) and current employment status (employed vs. unemployed). We might see the following findings:
Detailed description of charts.
In the observed survey response results:
- 9,623 users who did not respond were unemployed
- 2,572 users who did not respond were employed
- 46,731 users who did respond were unemployed
- 13,474 users who did respond were employed
In the expected survey response results
- 9,856.69 users who did not respond were unemployed
- 3,118.31 users who did not respond were employed
- 46,009.31 users who did respond were unemployed
- 14,55.69 users who did respond were employed
The above findings show a statistically significant relationship between responding to the job alert cancellation survey and the job seeker’s current employment status. This gives us a test statistic and p-value of 𝚾²(1) = 9.70 and p = 0.0018, respectively. Thus, significantly more unemployed job seekers responded to the job alert cancellation survey than would be expected at random.
This is an example of “missing not at random” because the survey question itself might have influenced how people chose to respond. Job seekers who are currently unemployed might be more inclined to respond to the job alert cancellation survey, because finding a job after a period of joblessness is a huge deal.
Best-case scenario: MAR
The best-case scenario for missing data is if it’s missing at random (MAR). In these cases, missingness can be correlated with at least one variable, and the missingness is not due to the survey question itself.
You might be thinking that I’m intentionally using jargon to confuse you…and I am! Just kidding, MNAR and MAR are commonly used among survey methodologists when discussing missing data. MNAR and MAR live in the same world of jargon as Type 1 and Type 2 error and mediation and moderation.
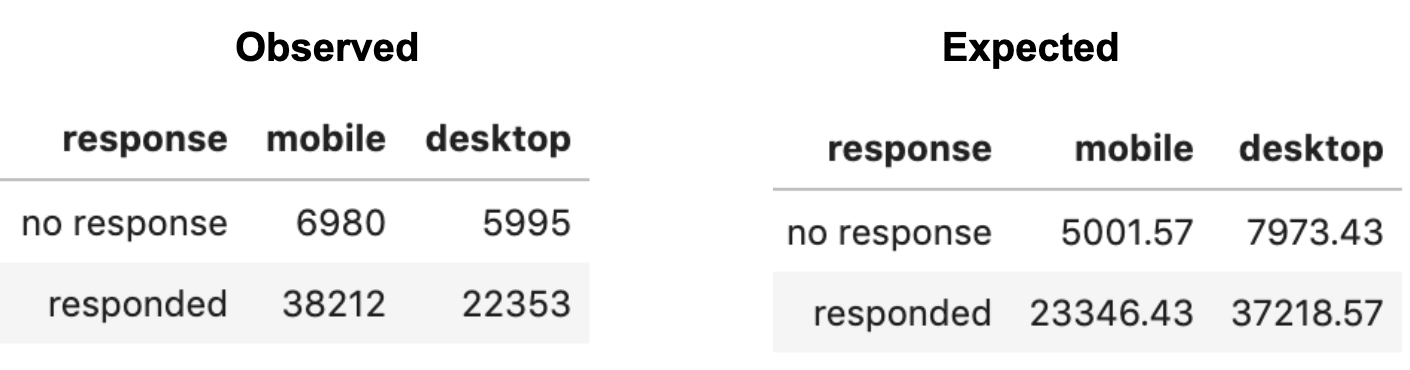
For example, let’s imagine that we ran a chi-square test on the job alert cancellation survey results to examine the relationship between survey response (no response vs. responded) and the job seeker’s device type (desktop vs. mobile). This gives us a test statistic and p-value of X²(1) = 75.57 and p < .0001, respectively. We might see the following findings:
Detailed description of charts.
In the observed survey response results:
- 6,980 users who did not respond were mobile users
- 5,995 users who did not respond were desktop users
- 38,212 users who responded were mobile users
- 22,353 users who responded were desktop users
In the expected survey response results:
- 5,001.57 users who did not respond were mobile users
- 7973.43 users who did not respond were desktop users
- 23,346.43 users who responded were mobile users
- 37,218.57 users who responded were desktop users
The above findings show a statistically significant relationship between job seekers responding to the job alert cancellation survey and those job seekers’ devices. Significantly fewer job seekers on desktop computers responded to the job alert cancellation survey than expected.
However, we might also know from previous experience that more job seekers search for jobs on mobile devices than desktops. In that case, the missingness is likely attributable to device popularity and not to the survey question itself.
Additional scenarios for missing data
Additional scenarios for missing data include cases where the data are missing completely at random, and cases where the data are missing by design.
Missing completely at random (MCAR) refers to cases where the missingness is uncorrelated with all other variables. This type of missingness is typically impossible to validate for large and complex data sets like those found in web analytics. With large data sets, especially rapidly growing ones, the chance of finding some spurious but significant correlation is almost 100%.
Missing by design refers to cases where the missingness is intentional. For example, imagine a product change where job seekers are only presented with the job alert cancellation survey if they applied for a job on Indeed in the past 30 days. In this scenario, job seekers who haven’t applied for jobs in the past 30 days will never see the survey. Data will thus be missing by design based on the number of applies.
The challenge of addressing missing data
A core challenge of missing data is determining if it’s missing due to randomness, and if so, then which type of randomness — MNAR or MAR. While it’s fairly easy to check for significant differences in the distribution of missing data, a p-value and confidence interval will not tell you why the data is missing.
Determining whether data are MNAR or MAR is a daunting task and relies heavily on assumptions. In the MAR example above, we assumed that the missingness was because users were more inclined to use the mobile version of Indeed than the desktop version. However, we only know this pattern exists because we’ve talked with people who noticed similar patterns in users preferring mobile over desktop. Without that knowledge we could very easily have misinterpreted the pattern.
Thankfully, there are strategies you can use to diagnose whether your data are MAR or MNAR.
To start, you can ask yourself:
Does the question ask people to reveal sensitive or socially undesirable behavior?”
If it does, be aware that asking people to reveal sensitive information is more likely to cause your data to be MNAR rather than MAR. It might be possible to reduce the impact of such survey design by reassuring confidentiality and using other strategies to gain the trust of respondents.
If the question does not ask people to reveal sensitive information but you’re still concerned the missing data might be MNAR (the bad one), you can try other strategies. If you have longitudinal data from the respondents, you can check whether the non-response pattern you observe is consistent with previous responses at other time points. If the pattern replicates, you can at least say that your observations are not unusual.
Of course, just because the non-response pattern replicates doesn’t mean you’re in the clear for declaring your data are MNAR and not MAR. If, for example, you’re asking people to report socially undesirable behavior, you’d likely see the same MNAR pattern over time.
If you don’t have access to longitudinal data, a second solution is to talk with people in your team/organization or look at papers from related research to see if anyone else has observed similar patterns of non-response. Another Research 2.0 solution might be to crowdsource via reaching out to colleagues on Slack and other social media. There you might discover if the non-response pattern you’re observing is typical or atypical.
This relatively simple yes/no logic isn’t perfect, but using the strategies above is still better than a head-in-the-sand “missing data never matters” approach.
Missing data isn’t always the end of the world
Not all missing data is inherently tied to response bias. It can be missing by design, missing completely at random (MCAR), missing not at random (MNAR), or missing at random (MAR). In the job alert cancellation survey, we saw how the survey design might lead to different scenarios of missingness.
Are you a data scientist or data aficionado who is also a critical thinker? If so, remember to take a deep dive into your missing data.
Suggested reading
De Leeuw, E. D. (2001). Reducing missing data in surveys: An overview of methods. Quality and Quantity, 35(2), 147–160. ← concise article on missing data and response bias
Kish, L. (1997). Survey sampling ← although this book is a bit dense, it’s a go-to resource for learning more about sampling bias
Tourangeau, R., & Yan, T. (2007). Sensitive questions in surveys. Psychological bulletin, 133(5), 859.
About the author
For a bit of background about myself, I’m a University of Michigan Ph.D. graduate (Go Blue!) who recently transitioned to industry as a Quantitative UX Researcher at Indeed.
Feel free to message me if you want to chat about my transition from academia to industry or if you just want to muse about missing data 😉
Interested in joining Indeed? Check out our available opportunities.
[1] It’s worth acknowledging that the topic of non-response bias is an enormous field. Several textbooks and many dissertations are available on this topic. For a deeper understanding of the field, check out my suggested reading section above. This is designed to be an easy resource you can reference when you are dealing with missing data.
Missing Data—cross-posted on Medium.


 The Git project relies completely on donations for its funds. Git has a few core contributors and a very long tail of developers who only work part-time on the project. These funds help us keep them involved, as they pay for travel to conferences, including our yearly Contributor Summit. We also use project funds for the Outreachy program, increasing the diversity of our contributor base.
 Funds will be mainly used to pay for future Homebrew maintainers to meet in person and may be used to pay for contractors to do some repeatedly postponed tasks around updating our CI setup.